


How much development aid is spent on climate change?
And does this crowd out funding for other aid projects?
This is a question I’ve had for a while. I care a lot about climate change. I also care a lot about basic health and development programs in the world’s poorest countries — vitamin supplementation, nutrition programs, antiretroviral treatment for HIV, and bed nets treated against malaria.
These two priorities could easily come into conflict. With a fixed aid budget, every dollar spent on climate programs is one less dollar for everything else. And with large cuts to foreign aid in the last few years, that budget is shrinking.
For a long time, I didn’t have good data to see whether this tension was real. But someone recently pointed me to the RioMarkers database, which tags aid projects according to whether they target environmental outcomes under the Rio Conventions (which include biodiversity, climate change mitigation, climate change adaptation, and desertification).1
Using it, we’ve constructed data on the amount of development aid allocated to climate-related projects, and how that compares with aid for other causes.
The headline statistic is that around one-fifth of development aid is now coded as climate-related.2
But the “climate-related” label is not as straightforward as it might seem. Some of these projects look like ones that would have happened regardless of climate change. Untangling how many matters for anyone concerned about where aid is being spent, regardless of whether their focus is on health, development, or climate.
How much foreign aid is climate-related?
Development aid comes in two forms. Bilateral aid flows from one country directly to another. Multilateral aid has a middleman; donors pool money with international organizations such as the World Bank or the World Health Organization, which then run programs themselves.
The RioMarkers database covers only bilateral aid, which makes up around 90% of global development aid. That’s what I’ll focus on here.
In 2024, donors committed around $210 billion as bilateral aid.
Around 31% of that went to things that aren’t specific to a project, such as hosting refugees in donor countries, administration, budget support, and debt relief. These can’t be coded as climate or non-climate-related projects, and are termed “non-allocable aid”. This is shown in the chart.
The remaining 69%, around $145 billion, went to specific projects. The second bar breaks this down into climate- and non-climate-related projects.
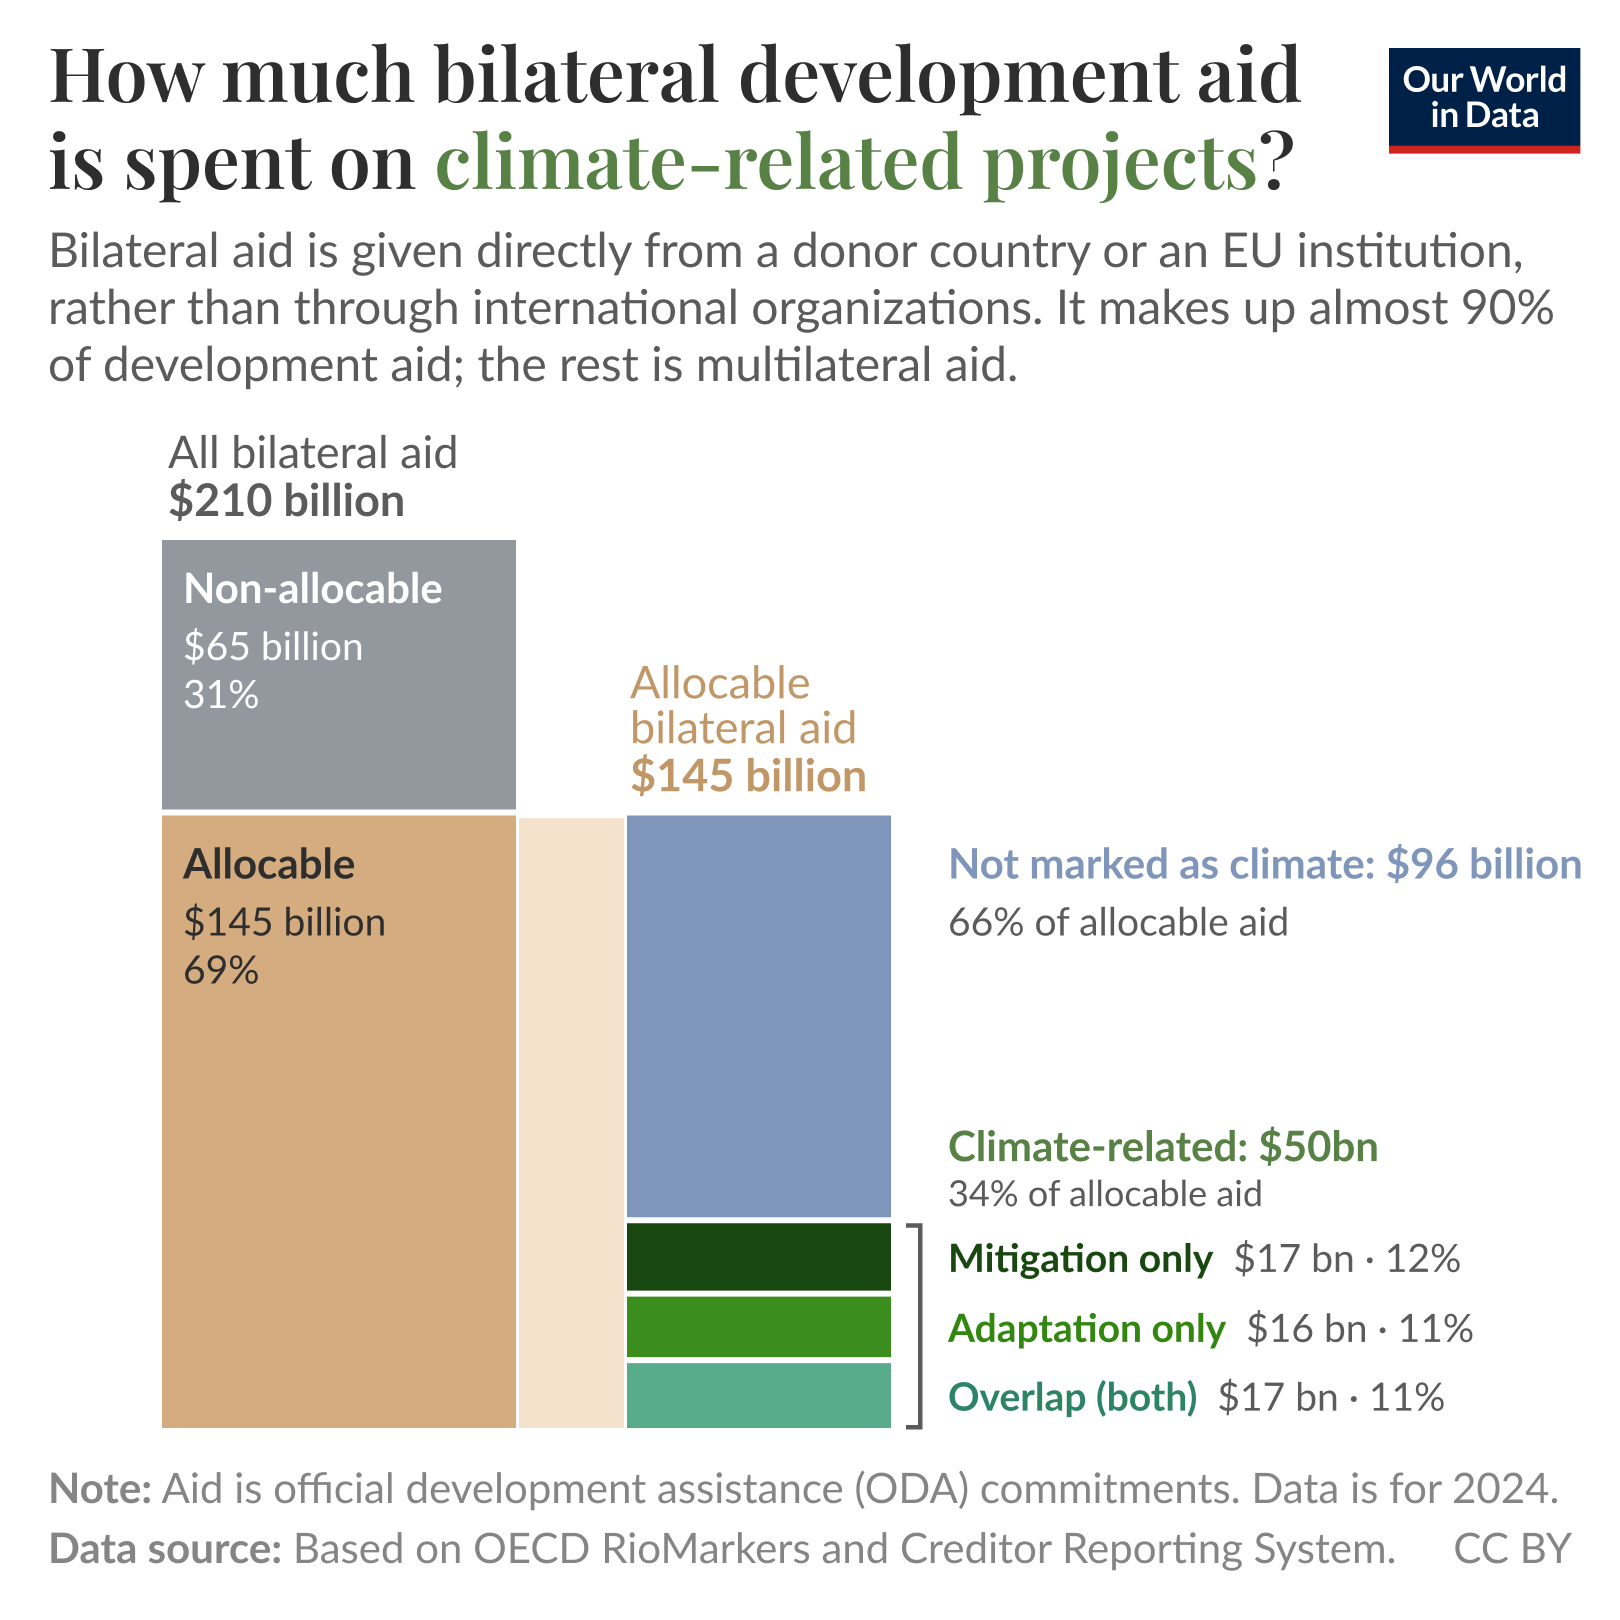
Around one-third of this funding — $50 billion — was committed to climate-related projects in 2024.
These projects can fall into two categories. Mitigation aims to reduce or avoid greenhouse gas emissions; think investments in clean energy, stopping deforestation, or low-carbon transport. Adaptation helps countries deal with the impacts of climate change: flood defenses, drought-resilient crops, or more reliable water supplies.
The headline statistic is that around one-fifth of development aid is now coded as climate-related.
Many projects count as both; they make communities more resilient to disasters while reducing emissions at the same time. Restoring mangroves, for example, can protect coastlines during storms, but also store carbon.
The second bar shows the split between mitigation-only, adaptation-only, and both. It’s roughly even, with mitigation-only projects making up slightly more than the others.
Putting all of this together, in 2024, climate-related projects made up:
- a third of bilateral, project-specific aid;
- almost one-quarter of all bilateral aid (including the non-allocable parts);
- around one-fifth of all development aid.
This last number assumes that no multilateral aid is given to climate projects, which seems unlikely. So the true share is probably slightly higher.
How has the amount spent on climate aid changed over time?
The RioMarkers data goes back to 2010. Then, around $22 billion globally was committed to climate-related projects. It’s worth noting that a significant share — around a third — of allocable aid wasn’t screened for being climate-related, so this is likely to be an underestimate.
The share of allocable aid that wasn’t screened declined substantially in the early 2010s and has remained below 10% since 2014.
By 2024, climate-related aid had increased to $50 billion.
You can see this in the chart below, which again breaks global bilateral project aid into climate and non-climate-related projects.
Total development aid, though, has also increased over this period. What if we look at the share of aid going to climate programs?
You can see this relative breakdown in the chart below. In 2010, around 18% went to climate-related projects (which, again, might be an underestimate for the reason above). By 2024, it had grown to 34%.
The type of projects has also changed. In 2010, most climate funding was allocated to mitigation projects. But over time, adaptation has become more prominent, and today, programs that include some form of adaptation outspend those focused solely on mitigation.
What counts as climate-related aid?
What does this 34% figure for 2024 actually include?
The RioMarkers database not only codes a project as mitigation or adaptation, but also as having climate change as its primary or secondary objective. A project with climate as its main objective probably wouldn’t exist in a world without climate change. One with it as secondary might still go ahead for other reasons; the climate benefits are a bonus.
As you can see in the chart, more than half of climate-related funding goes to projects where it’s only a secondary objective. All funding for these projects is counted in its full value, not just the share we might attribute to climate.
It’s hard to know the counterfactual, but many of these programs would probably have gone ahead regardless. If we only counted projects with climate as their main objective, climate’s share of bilateral project aid would fall from 34% to 13%.
Looking at individual projects in the database, we started to see why drawing this line is complicated.
Japan committed around $310 million to Iraq for its Samawah Water Supply Improvement Project, which is building climate-resilient water infrastructure in a drought-prone area. It’s tagged as an adaptation project, with climate as the main objective. But basic water supplies in a region prone to drought seem like a core development need. Perhaps it would have been funded anyway.
France provided $122 million to Tanzania to build its Kakono hydroelectric power plant. It provides low-carbon electricity, which has an obvious link to climate. In the database, climate is coded as a primary objective. But access to energy is a development goal in and of itself. High-income countries were funding energy infrastructure projects in low- and middle-income countries, long before aid statistics had a climate tag attached.
Finally, South Korea provided $163 million for a hospital and training center in Tanzania. Building a hospital and healthcare facilities is a fairly standard development aid project. But because it’s built with energy efficiency and low-carbon design in mind, it’s counted as mitigation as a secondary objective. It doesn’t exist to tackle climate change, but all of this $163 million counts as climate-related aid.
There are many similar cases where it’s hard to disentangle whether climate change is the reason aid was given, or it’s just a label put on a project that would have gone ahead anyway.
What’s still not clear
Ideally, all of this climate funding would be additional: funding for everything else could stay the same, and new money would be available for climate change. But that scenario seems unlikely. Many countries view climate finance as part of their overseas commitments, not as something on top.
That leaves two concerns, which pull in opposite directions.
The first is displacement: climate projects could divert funding from more traditional ones. Clean energy infrastructure could crowd out antimalarial bed nets, or anti-deforestation projects could divert money from maternal nutrition programs.
The second is relabeling: traditional aid programs with a climate code attached. Donor countries have often committed to climate finance in addition to their aid spending, not instead of it. If this is simply an exercise in relabeling, they are ticking off these commitments without providing any new money.
For example, when a new hospital gets a climate tag for being energy efficient, no bed nets are lost, but no new climate money is generated either.
My guess is that both are happening. That more than half of climate funding has it as a secondary objective gives some evidence of this. But this data can’t tell us how much of each is happening.
Answering that would need a detailed analysis of historical aid projects: how they compare with modern ones, and how aid allocations to non-climate sectors, such as health, infrastructure, and humanitarian response, have changed as the climate’s share has grown.
If anyone is interested in taking this on, please do. With so much aid now tagged with a climate label, and global budgets shrinking, it’s a question with an important answer.
Acknowledgments
Thank you to Richard Tol for pointing me to the RioMarkers database, which made this analysis possible. Thanks also to Edouard Mathieu and Max Roser for editorial feedback and suggestions.

What is foreign aid? How “Official Development Assistance” is measured
Foreign aid measurement is complicated — what exactly counts as Official Development Assistance, what doesn’t, and how much is actually spent abroad?
Foreign aid from the United States saved millions of lives each year
For decades, these aid programs received bipartisan support and made a difference. Cutting them will cost lives.

Climate change will affect food production, but here are the things we can do to adapt
Adapting planting dates, selecting better crop varieties, and increasing access to irrigation and fertilizers could offset potential declines in crop yields.
Endnotes
Thanks to Richard Tol for pointing me to this dataset, and his preliminary analysis.
Note that this data is far from perfect. Not all countries screen all of their aid for climate objectives; this was particularly true in the earlier years of this categorization. For example, in 2010, 37% of aid was not screened. By 2014, this unscreened share had fallen under 10%, and the data has been much more complete since then.
So the specific year-to-year figures are uncertain. But we still think that the headline numbers — a third of bilateral aid and around a fifth of development aid — are decent estimates.
Cite this work
Our articles and data visualizations rely on work from many different people and organizations. When citing this article, please also cite the underlying data sources. This article can be cited as:
Hannah Ritchie and Pablo Arriagada (2026) - “How much development aid is spent on climate change?” Published online at OurWorldinData.org. Retrieved from: 'https://archive.ourworldindata.org/20261026-063310/how-much-development-aid-is-spent-on-climate-change.html' [Online Resource] (archived on October 26, 2026).BibTeX citation
@article{owid-how-much-development-aid-is-spent-on-climate-change,
    author = {Hannah Ritchie and Pablo Arriagada},
    title = {How much development aid is spent on climate change?},
    journal = {Our World in Data},
    year = {2026},
    note = {https://archive.ourworldindata.org/20261026-063310/how-much-development-aid-is-spent-on-climate-change.html}
}
Past versions
We are a live site and we keep our work maintained. So our articles are often changed, including the data. You can browse previous versions of this work here.

Reuse this work freely
All visualizations, data, and articles produced by Our World in Data are completely open access under the Creative Commons BY license. You have the permission to use, distribute, and reproduce these in any medium, provided the source and authors are credited.
The data produced by third parties and made available by Our World in Data is subject to the license terms from the original third-party authors. We will always indicate the original source of the data in our documentation, so you should always check the license of any such third-party data before use and redistribution.
All of our charts can be embedded in any site.